Frequently Asked Questions
Acronyms
- ARS Agricultural Research Service
- CDC Center for Disease Control
- CM Cooking Method
- CS Cooked Status
- CSFII Continuing Survey of Food Intake by Individuals
- DEEM Dietary Exposure Evaluation Model
- DHHS Department of Health and Human Services
- EFH Exposure Factors Handbook
- EPA Environmental Protection Agency
- FCID Food Commodity Intake Database
- FF Food Form
- FIFRA Federal Insecticide, Fungicide, and Rodenticide Act
- FNDDS Food and Nutrient Database for Dietary Studies
- g Grams
- JIFSAN Joint Institute of Food Safety and Nutrition
- MEC Mobile Examination Center
- NHANES National Health and Nutrition Examination Survey
- OPP Office of Pesticide Programs
- PSU Primary Sampling Units
- SCS Supplemental Children’s Survey
- SE Standard Error of the Mean
- SHEDS Stochastic Human Exposure and Dose Simulation
- USDA United States Department of Agriculture
- WWEIA What We Eat in America
1. What is the FCID Consumption Calculator?
2. What kind of information can I get from the FCID Consumption Calculator?
3. How is national food consumption surveyed in the U.S.?
4. What is FCID and why was it developed?
5. What is the role of U.S. EPA's Office of Pesticide Programs (OPP) in food safety?
6. How does U.S. EPA's Exposure Factors Handbook use FCID?
7. How was FCID developed and what information is included in the FCID database?
13. What limitations does FCID have when assessing dietary exposure and commodity consumption?
16. Why do some recipes add up to less than or greater than 100 grams?
23. What is the difference between "Eaters Only Population" and "Per Capita"?
24. How does the calculator define pregnancy and breastfeeding?
25. What is the best way to interpret results when I search for multiple food commodities combined?
27. What Criteria does the FCID calculator use to determine reliability of percentiles?
1. What is the FCID Consumption Calculator?
The Food Commodity Intake Database (FCID) Consumption Calculator is an application that uses National Health and Nutrition Examination Survey/What We Eat in America (NHANES/WWEIA) food intake and FCID recipes to estimate food commodity consumption for the purposes of pesticide dietary exposure assessment, as well as consumption estimates for the Environmental Protection Agency’s (EPA) Exposure Factors Handbook (EFH) users.
2. What kind of information can I get from the FCID Consumption Calculator?
The Food Commodity Intake Database (FCID) Consumption Calculator provides distributions of food and water intake rates for user selected age groups and population groups. Tables generated by the tool can be downloaded into Excel and Word formats for further analysis.
3. How is national food consumption surveyed in the U.S.?
For purposes of dietary risk assessment, OPP developed its current exposure assessment methodology using USDA's Continuing Survey of Food Intakes by Individuals 1994-96, 1998 (CSFII 1994-96/1998). CSFII 1994-96/1998 was statistically designed to be nationally-representative of U.S. food consumption and was the 10th nationwide USDA food consumption survey (USDA, 1997). The 1998 survey period of CSFII focused on children ages 0 through 9 and was a supplement to the CSFII 1994-96. It used the same sample design as the CSFII 1994-96 and was intended to be merged with CSFII 1994-96 to increase the sample size for children.
Following CSFII 1994-96/1998, USDA partnered with the Department of Health and Human Services (DHHS) and integrated CSFII with DHHS' National Health and Nutrition Examination Survey (NHANES) in 2002. Under this partnership, USDA's food consumption survey was renamed "What We Eat In America" (WWEIA) and is conducted on a two-year cycle on a continuous basis as part of NHANES. While data is collected through NHANES, USDA maintains responsibility for development of dietary data collection methods, maintenance of food and nutrient databases, and data review and processing. For further information on WWEIA survey design and data collection methods, please visit: www.ars.usda.gov/Services/docs.htm?docid=13793 .
Both CSFII and WWEIA use similar data collection methods and generally capture similar information on U.S. food consumption. Specifically, both CSFII and WWEIA collect two non-consecutive days of dietary recall data using a USDA dietary data collection method called the Automated Multiple-Pass Method. While both surveys collect similar data and have a similar data structure, there are some key differences between the surveys. One key difference for OPP dietary exposure assessment purposes is that CSFII provides data related to the region and season. This regional and seasonal data is no longer publically available through NHANES in order to protect the confidentiality of respondents who also undergo a comprehensive medical examination and provide detailed medical history and health information through a series of interviews. Another important difference between the surveys is that the 1998 survey period of CSFII specifically oversampled young children at the request of EPA as part of its Supplemental Children's Survey (SCS). While children have not been oversampled through NHANES, multiple survey cycles can be combined to increase the sample size of infant and child age groups.
4. What is FCID and why was it developed?
FCID is a translated version of CSFII and later NHANES data that expresses the intake of consumed foods in terms of food commodities. When conducting dietary risk assessments, OPP is most interested in consumption of food commodities in the form of ingredients such as beef, wheat flour, tomato sauce, soybean oil, etc. rather than foods "as eaten" (e.g., lasagna). This is because substantially more pesticide residue concentration data – from EPA-required field trials and/or from the USDA's Pesticide Data Program - is available on pesticide residues on food commodities (aka ingredients) than on foods per se. While the CSFII and WWEIA surveys provide extensive, statistically representative information on food consumption, information on food commodity consumption (i.e., foods expressed in terms of ingredients) is not present in CSFII or WWEIA . As a result, the FCID was developed for use by EPA and other organizations, including EFH users when conducting exposure assessments which are most appropriately done on an "ingredient" or "food commodity" basis. WWEIA-FCID 2005-10 is intended to complement the CSFII and NHANES/ WWEIA databases in that it provides estimates of food consumption as commodities as opposed to foods "as eaten".
The FCID and consumption files have been incorporated into EPA/OPP's primary dietary exposure model, Dietary Exposure Evaluation Model (DEEM) , and have also been used to derive the fruit, vegetable, meat/poultry, dairy, grain, and seafood consumption estimates which are reported in EPA's 2011 Exposure Factors Handbook. Thus, consumption estimates developed using the raw FCID data available in .csv format on the JIFSAN website, using the FICD Consumption Calculator, or using the DEEM dietary exposure model will be equivalent (to numerical round-off error).
For further information on EPA/OPP's risk assessment process, please visit: www.epa.gov/pesticides/about/overview_risk_assess.htm . A more complete and technically-focused description of the human health risk assessment process used by OPP – including how dietary consumption data is used to evaluate exposure and risk and probabilistic approaches used in developing these estimates – is available in a downloadable pamphlet from Purdue University entitled Pesticides and Human Health Risk Assessment: Policies, Processes, and Procedures.
5. What is the role of U.S. EPA's Office of Pesticide Programs (OPP) in food safety?
EPA is responsible for the registration of pesticides under the Federal Insecticide, Fungicide, and Rodenticide Act (FIFRA) and Food Quality Protection Act of 1996. Under FIFRA and FQPA, EPA evaluates the potential health effects of pesticides using a scientific process called risk assessment, which requires EPA to assess the potential human health risks of pesticide exposure through food and drinking water consumption. This requires EPA to perform dietary risk assessments that incorporate information on U.S. food consumption and monitoring data on pesticide residues in and on foods. As such, data on U.S. food consumption plays a critical role in EPA's risk assessment of pesticides.
6. How does U.S. EPA's Exposure Factors Handbook use FCID?
EPA's Exposure Factors Handbook (EFH) uses FCID to derive intake rates for various foods and food groups. These data are presented in Chapters 9, 10, 11, and 12 of the handbook. While OPP is interested in food commodities, the EFH groups the foods into broader categories to be used in certain types of chemical- and site- specific risk assessments.
7. How was FCID developed and what information is included in the FCID database?
FCID was originally developed using USDA's CSFII (1994-96/1998) and now contains intake data and related information on over 500 commodities listed in the EPA's Food and Feed Commodity Vocabulary. The FCID database is the result of cooperative efforts by USDA/ARS and EPA/OPP and translates food consumption as reported eaten in WWEIA (1999-10 survey cycles) and CSFII (1994-96/1998) surveys into consumption of U.S. EPA-defined food commodities. The FCID consists of a number of component database parts which can be found on the JIFSAN website. Descriptions of each database component can be found under the " Database Contents " tab, but the major data tables making up the FCID are listed below:
- FCID Recipe Database: used to translate WWEIA food consumption to consumption of agricultural food commodities.
- Commodity Specific Food Consumption: contains commodity-specific consumption by WWEIA respondent sequence number (SEQN) and day code (DAYCODE).
- Commodity-Specific Food Consumption – Detailed: contains commodity specific consumption by WWEIA respondent sequence number (SEQN), day code (DAYCODE), food form (FF), cooking method (CM), and cooked status (CS).
- WWEIA Demographic Data: Select demographic data and bodyweight data from WWEIA, including statistical survey weights, PSUs, and strata.
8. I've heard the acronyms CSFII, NHANES, WWEIA, FCID, and FNDDS? What are they, how are they interconnected, and how was each used (or not) in creating the data on the JIFSAN website?
- Continuing Survey of Food Intake by Individuals (CSFII) – USDA survey designed to measure the types and amounts of foods consumed from a nationally representative sample of children and adults in the United States. EPA/OPP's dietary exposure assessment methods, including the development of FCID, were originally based on CSFII (1994-96/1998).
- National Health and Nutrition Examination Survey (NHANES) – A series of studies conducted by DHHS that are designed to assess the health and nutritional status of a nationally representative sample of children and adults in the United States. Beginning in 1999, the CSFII was integrated into the NHANES survey and was renamed the "What We Eat In America" component.
- What We Eat In America (WWEIA) – WWEIA represents the integration of CSFII with NHANES. NHANES is responsible for data collection and USDA is responsible for the development of dietary data collection methods, maintenance of food and nutrient databases, and data review and processing. EPA/OPP's dietary exposure assessment methods have been updated to reflect dietary consumption reported in WWEIA 2005-10.
- Food Commodity Intake Database (FCID) – EPA database developed in collaboration with USDA. The recipes within the FCID translate food consumption as reported eaten in WWEIA (1999-08 survey cycles) and CSFII (1994-96, 1998) surveys into consumption of U.S. EPA-defined food commodities
- Food and Nutrient Database for Dietary Studies (FNDDS) – A USDA database of foods, their nutrient values, and weights for typical food portions. FNDDS can be used to analyze dietary consumption data from WWEIA and also incorporates food composition data from USDA's National Nutrient Database for Standard Reference. When updating FCID for analysis of NHANES/WWEIA , FNDDS was utilized to identify the components of new foods reported consumed by WWEIA survey respondents. The FNDDS is often used to estimate nutritional aspects of the American diet, and for some foods does not always need to break down foods reported "as eaten" to a US EPA food commodity level. For example, FNDDS recipes may include pasta and cheese as a part of a recipe for lasagna which is a sufficient breakdown of ingredients for nutritional assessment purposes, but not for dietary exposure purposes when pesticide residue information is not available for pasta and cheese but instead is available for wheat flour and milk. Thus, FCID recipes further convert these pasta and cheese to the EPA food commodities of wheat flour and various components of milk which are EPA food commodities and thus can be used to assess dietary exposure.
9. If FCID just combines the WWEIA consumption estimates from NHANES and the FNDDS food composition data from USDA, why can't I just do that myself? What additional value-added and information does the FCID provide?
FNDDS is a database that provides the nutrient values for foods and beverages reported in WWEIA. FNDDS is used to generate the nutrient intake data files for WWEIA. FNDDS and FCID provide similar information on the composition of WWEIA foods. In many cases, however, FNDDS does not sufficiently break food components down into the individual commodities that are needed by EPA/OPP and EFH users when conducting dietary risk assessments. For example, FNDDS lists wheat tortillas as a food component, whereas EPA needs commodity-level information on the components of tortillas (e.g., wheat flour, soybean oil, cottonseed oil, etc.). In addition, FNDDS does not provide ancillary information such as cooked status, cooking methods, and food form which can be useful for dietary exposure assessments of pesticide residues and food contaminants since residues may be affected by cooking. As such, FCID complements FNDDS and provides more specific information on food commodities defined in EPA's Food and Feed Commodity Vocabulary.
10. What’s the difference between the FCID Food Commodities and EPA Exposure Factors Handbook water and food groups? Why is water included in both?
The FCID Food Commodities translates the foods eaten by individuals into their ingredients. It is widely used in the characterization of exposures to pesticide residues. The EPA Exposure Factors Handbook also uses FCID, but foods are grouped into categories (e.g., total fruits, total vegetables). For example, searching for the “food commodity” “apple” under the FCID Food Commodities option will result in a list of several items that contain the word “apple” such as apple with peel, apple juice, apple sauce, etc. The user can select any or all of those items to calculate intake rates for each food commodity, and choose to have these reported individually (i.e., on an item-by-item basis) or combined. Selecting “Apples” as a food group in the “EPA Exposure Factors Handbook search”, on the other hand, will result in an intake rate that includes all forms of apple in the EFH “Apples” group:
Apples: Apple, dried | Apple, dried-babyfood | Apple, fruit with peel | Apple, peeled fruit | Apple, peeled fruit-babyfood | Apple, sauce | Apple, sauce-babyfood
This selection will often be equivalent to selecting every “apple” food commodity from the FCID Food Commodity search and, in Report Options, using the “combined” option report type.
Water that is included as a commodity in the FCID Commodity search includes direct tap water, direct bottled water, and indirect water from all sources. In the Exposure Factors Handbook tab, the user can search for Water-All Sources, Water-Community (which includes both direct and indirect water consumption), Water-Bottled, and Water-Other Sources. See definitions of direct and indirect water intake in FAQ #14.
11. Why does the calculator have EPA EFH default (population groups) and EPA Pesticide default (population groups)?
“EFH default” population groups are more general and used in different program offices within EPA. EPA “Pesticide default” population group is more specific and used within OPP for pesticide regulation purposes. It can be observed that “EFH default” age groups are more finely defined and may have a smaller sample size than the “Pesticide default” age groups in general. It should be noted that small sample size impacts the reliability and precision of the estimates for the inference to the population. In addition to age groups, the user can select other demographic groups included in the NHANES/WWEIA dataset including: Mexican American, non-Hispanic black, non-Hispanic white, other Hispanic, other race including multiple, males, females, pregnant females, and lactating females.
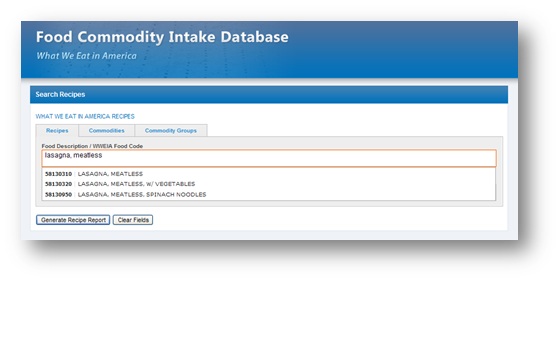
12. I hear continuing reference to the FCID "recipe files" or "100 gram files". What are they, how are they used, and where can I get them?
The FCID recipes are what are used to convert food consumption reported in CSFII (1994-96, 1998) or WWEIA (2005-10) into intake of food commodities defined in EPA's Food Commodity Vocabulary. The FCID recipes are available for download on the JIFSAN website in .csv format ( fcid.foodrisk.org/dbc/ ) and are both fully searchable using a JIFSAN-developed web application ( fcid.foodrisk.org/recipes/ ) and fully printable after conversion of each recipe to a .csv spreadsheet-like file using the web button labeled "Convert Results to CSV" on the upper right hand side of the webpage. Here is a screenshot of the recipe page showing the beginnings of a search for recipes for meatless lasagna, with the user subsequently selecting one of the three meatless lasagna choices and clicking the "Generate Recipe Report" to obtain the relevant recipe/100 gram file:
The FCID recipe database can also be "reverse-searched" by commodity using the "Commodities" tab instead of the "Recipes" tab such that all CSFII or WWEIA foods containing a given EPA commodity can be listed. For this latter search, clicking on the "Generate Recipe Report" at the bottom of the page will generate a list of all the foods that contain the user-selected commodity (ingredient).
FCID recipes are expressed as grams of commodity per 100 grams of the food reported consumed in CSFII or WWEIA (i.e., equivalent to percent). They are used by EPA to convert all foods reported "as eaten" into their agricultural commodity equivalents. For example, what was reported by a WWEIA survey respondent as a 1/8 slice of a 12" pepperoni pizza (e.g., PIZZA W/ PEPPERONI, NS AS TO TYPE OF CRUST, WWEIA Food Code: 58106540) would be converted in FCID to gram amounts of wheat flour, beef and pork, various components of milk (reflecting the cheese), tomato puree, soybean oil, etc. for that respondent. All of the demographic information associated with that respondent as collected by CSFII or NHANES such as socio-economic status, age, race/ethnicity, etc. and other information such as body weight and other anthropometric measurements is also retained with that record. FCID also contains additional information with respect to the cooked status (yes/no), cooking method (baked, broiled, fried, etc.) and food form (fresh, frozen, canned, pickled, etc.) of each of the ingredients, information that is not available in CSFII or WWEIA.
13. What limitations does FCID have when assessing dietary exposure and commodity consumption?
FCID was developed primarily to assist OPP in the estimation of food commodity intake for use in dietary exposure and risk estimates for pesticide residues in food. EPA’s Office of Research and Development has also used FCID in the estimation of food intake rates in the development of the Exposure Factors Handbook. When using FCID to estimate food commodity consumption, it is important to consider a variety of limitations and caveats that may exist. For example:
- Many of the recipes in the current version of FCID were originally developed for and correspond to the USDA's CSFII 1994-96, 1998 which was developed jointly by USDA and EPA. These recipes have not been updated in the current FCID to account for what may be changes in commercial food products over the intervening period. For example, it may be that current commercial frozen lasagna may have changed (e.g., different ingredients and/or different amounts of ingredients) and is now different from the original recipes that were developed for the 1994-96, 1998 CSFII. While USDA updates their FNDDS database for each cycle of the NHANES/WWEIA survey, OPP did NOT update the recipes present in FCID to reflect these changes. Thus, many of the ingredients and amounts listed in FCID for commercial food products are based on older commercial formulations and may not reflect the most current information regarding the nature and amounts of ingredients that these products contain.
- For new or modified foods reported in WWEIA that were not present in CSFII, 1994-96, 1998, OPP did develop new recipes, with ingredient amounts in recipes for commercial products estimated based on available older recipes, professional judgment, and – where necessary - mathematical algorithms. For example, if lasagna with chicken or turkey were reported in WWEIA but not reported in the older CSFII survey, an older CSFII recipe for lasagna with beef would be modified by changing the grams of beef to grams of chicken and turkey. In all cases, mass-balance was maintained. Ingredients and amounts for other food mixtures were based on representative recipes, usually from popular cookbooks but also from regional or specialty cookbooks when necessary. The recipes were generic and were not specific for each sample person.
- When developing recipes, ingredients contained in food items in the CSFII/WWEIA surveys were matched to food commodities defined in EPA's Food and Feed Commodity Vocabulary. While most ingredients were matched to commodities, EPA's Food and Feed Commodity Vocabulary focuses on agricultural commodities that can be treated with pesticides and does not include ingredients that tend to be highly processed or produced in a controlled manufacturing environment. These types of ingredients include salt, yeast, artificial sweeteners, and food additives.
- For some food commodities, there are very few survey respondents who report consuming that commodity. In those instances, the uncertainty around estimated consumption can be quite large. The database user should keep in mind that statistical estimates based on a small number of survey respondents may be less statistically reliable than estimates based on larger numbers of respondents. Additional information regarding sample size and associated statistical caveats and limitations can be found under the button labeled "Caveats regarding the Use of the Percentile Calculator" located in the upper right hand corner under the "Commodity Weight Percentiles" screen.
- Specific oil ingredients in food reported consumed in CSFII and WWEIA could not be determined when the oil type was not specified. As a result, assumptions were made about the proportion of different types of oil, based on market share information from USDA's Economic Research Service and Foreign Agricultural Service. Similarly, estimates for sugar were derived from market share information on sugar from sugarcane and sugar beets.
Given the above considerations and limitations, FCID is perhaps best suited for (and accurate in) estimation of consumption of fruits and vegetables that are consumed as fresh, frozen, or canned forms as well as of meats, poultry, seafood, and dairy products. FCID is probably less suited for estimating consumption of ingredients in highly processed foods or foods that are consumed mainly as ingredients in commercially-prepared foods for which recipes may have changed or for which ingredient amounts are estimated. For purposes of pesticide exposure and risk assessments, this limitation is not likely to be of any practical or significant importance since most highly-processed/commercially-prepared foods are expected to contain only minimal pesticide residues, particularly when compared to their fresh fruit and vegetable counterparts. If primary interest resides in estimating nutrient intakes, intakes of food ingredients that are not expressed on an EPA food commodity basis (e.g., pasta instead of wheat flour), or for intake of fats and oils, other data sources such as USDA's Food Nutrient Database for Dietary Studies (FNDDS), may be more appropriate.
14. What's the difference between "direct" water consumption and "indirect" water consumption? And what is meant by "community water"?
The FCID Commodity tab contains three choices of water available for analysis: Water, direct, tap; water, direct bottled; and water, indirect, all sources. The EPA EFH Water/Food Groups tab contains the following choices: water – all sources; water – community; water – bottled; and water – other sources. These are defined below.
Direct water is water consumed from a tap or faucet (“water, direct, tap”) or from bottled water (“water, direct, bottled”). For example, drinking fountain water, tap water from restaurants, and your kitchen sink (including filtered water like Brita) are all direct water sources. Bottled water includes those bought in stores (e.g., Evian) as well as water from a water cooler (e.g., Poland Spring in your office).
Indirect water is water added by a food preparer (individual or restaurant) to make beverages or foods. For example, water added to re-constitute frozen orange juice concentrate or to make tea, coffee, infant formula, soups, and pasta, would be considered in calculation of consumption of indirect water. For example, when (dry) pasta such as spaghetti is boiled, it absorbs a certain amount water, and this water is considered indirect water when consumed, with the amount based on the difference in water content between dry (uncooked) and cooked spaghetti.
In EFH, community water is defined as the sum of direct tap water and indirect water derived from community water supply. The DRTWS variable in the DRTOT file describes tap water sources. All tap water was assumed to come from a community water supply.
Bottled water includes bottled water consumed directly as a beverage. It does not include bottled water used in the preparation of foods.
Water, other sources includes water consumed from sources other than community and bottled water (e.g., well water, rain cistern).
Due to changes in the structure of questions in the WWEIA survey, it is difficult to determine the source of indirect water – again, defined as water added to soup, powdered infant formula, juice concentrates, etc. Thus, while previously (i.e., in CSFII) indirect water had multiple potential sources – such as “water, indirect, tap”, “water, indirect, bottled” – any indirect water contribution is now assigned “water, indirect, all sources,” which includes community water.
15. Does calculation of water consumption include water in sodas and other beverages or commercial water added by the food processors to other food items (e.g., ready to eat soup)? How about water that is intrinsic to fruits and vegetables and other foods?
No, only water that is directly consumed via tap or bottle (direct water) or water added by the food preparer (indirect water) is considered. Any water that is added by a commercial food processor (e.g., ready-feed formula, canned soups, soda) is not included in the drinking water consumption calculation. Any water that is intrinsic/biological (e.g., the natural water content in oranges, watermelons, apples, etc.) is not part of drinking water consumption; it is part of the Raw Agricultural Commodity. Therefore, the recipe for cola consists of 13.7% corn syrup, and no water because it is commercially added by the food processor. However, infant formula prepared at home from powder consists of about 85% indirect water, which would be included in the drinking water consumption (in this case, as indirect water). On the other hand, ready-to-feed formulas do not provide any contribution to drinking water consumption as recorded or defined in FCID because they contain water that is commercially added.
16. Why do some recipes add up to less than or greater than 100 grams?
Recipes included in the FCID are created and standardized using a “portion size” of 100 grams. The recipes are designed to indicate how much of a food commodity (e.g., tomato) is consumed per 100 grams of a food (e.g., lasagna). A 10 gram margin of error was permitted for all recipes, so most recipes fall within the range of 90 – 110 grams. However, FCID includes a number of recipes with sums that deviate from 100 grams by amounts greater than the 10 gram margin of error. These are described below:
- Deviation in the recipes can be explained in the accounting of both “commercial water” and (the removal of) water during home/restaurant preparation of foods. As described in a previous FAQ, “commercial water,” or water that is added during processing at a food manufacturing facility, is not included in recipes. As a result, recipes for foods that have water added at a food manufacturing facility will be less than 100 grams. For example, the recipe for “chicken noodle soup, canned, low sodium, ready-to-serve” (WWEIA Food Code 58403030), sums to ~12 grams and contains no water. This is because the ready-to-serve soup had water added at the manufacturing facility and the FCID recipe does not include “commercial water.” When an individual makes homemade chicken noodle soup [i.e., “chicken noodle soup, home recipe” (WWEIA Food Code 58403040)], the recipe sums to ~100 grams and includes the indirect water added to make the soup.
- Recipes that sum to well above 100 grams generally do so because it takes more than 100 grams of ingredients to make 100 grams of the finished food item. For example, because jelly loses a substantial amount of water when it is made, the recipe for “jelly, all flavors” (WWEIA Food Code: 91401000) sums to 412 grams. Since so much water is lost in the production process, the 100 gram recipe must start with more than 100 grams of the ingredients (e.g., grape, strawberry, and apple juices and corn syrup) to end with 100 grams of jelly. Jams are similar, in that it takes more than 100 grams of fruit to produce (or net) 100 grams of jam (e.g., “jam, preserves, all flavors”, WWEIA Food Code 91402000, sums to 299 grams).
17. How is 2-day average consumption estimated? Does it include survey respondents with zero consumption on any one of the two days?
The WWEIA food consumption surveys obtained detailed information (food item, amount and time of each eating/drinking occasion) regarding what respondents ate and drank during the previous 24 hours. This food consumption information was collected on two occasions: the in-person interview at the Mobile Examination Center (MEC) and through a follow-up phone call interview performed approximately 3 to 10 days later. The FCID Consumption Calculator uses only the information from WWEIA respondents that provided the full 2 days of food consumption data (i.e, both days) (some respondents did not participate in the phone interview). The “2-day average” results are based on the average of the two-days of food consumption reported in the NHANES/WWEIA survey for those "both day" respondents. Suppose a survey respondent reported consumption for day-1 as 45 gm and day-2 as 60 gm for a given commodity (or commodity group or EFH group). His/her 2-day average consumption amount will be (45+60)/2 or 52.5 gm. If the respondent reports zero consumption on one of the two days and non-zero consumption on the other day, his/her average consumption would be the average of zero and nonzero consumption. Suppose day-1 consumption for that respondent is 0 gm and day 2 consumption is 25 gm, then the average two-day consumption will be (0+25)/2 or 12.5 gm. If the respondent reported zero consumption for both of the days, then the average consumption would be zero; importantly, however, the respondent in this case will be considered as a “non-eater” and will only be included in the “Per Capita” consumption estimate, not in the “Eaters Only Population” consumption estimate.
In doing the above calculation and adjusting for the U.S. population, the NHANES 2-day sampling weights are used. Briefly, records for 2-day average consumptions are weighted by the variable WT6_2DAY which appears in the demographic file, WWEIA_DEMO_0510.csv. The remaining variables relating to PSU and strata (SDMVPSU and SDMVSTRA, respectively) do not need to be changed to account for 2-day weighting.
It is important to note that the 2-day average consumption period is not meant to imply that exposures occur only during a 2-day exposure period. The use of these data for assessing chronic exposures should be done with caution, since the data represent intake rates from two nonconsecutive days (and generally separated by 3 to 10 days).
18. How do we know that the results reported in the FCID Consumption Calculator are correct? What kind of review was done on the results?
The FCID Consumption Calculator and further enhancements have been developed in close collaboration with EPA/OPP and EPA's Office of Research and Development (ORD). EPA/OPP has done extensive testing of the calculator and closely reviewed the results to ensure that they provide accurate intake estimates. As part of this review process, EPA/OPP made comparisons between the FCID Consumption Calculator and EPA/OPP's Dietary Exposure Evaluation Model (DEEM). These comparisons confirm that the FCID Consumption Calculator provides accurate summary statistics that can be customized to evaluate intake in different population groups based on age, gender, and race/ethnicity. An example of a QA/QC spreadsheet that was prepared to evaluate and compare the consumption estimates for various commodities among various age groups is presented here .
19. I'd like to look at regional and seasonal consumption data (e.g., apple, fresh with peel in the Northeast during the autumn). I used to be able to do that with CSFII, but I don't see that option with the FCID Consumption Calculator (although age, sex, and race/ethnicity are available). How can I drill down into the data and get this information?
Regional and seasonal information are no longer available in the WWEIA consumption data that is made publicly available by the CDC's National Center for Health Statistics (NCHS). As such, it is not possible to use WWEIA-FCID 2005-10 or the FCID Consumption Calculator to evaluate regional or seasonal differences in consumption.
20. I am interested in using the JIFSAN data to explore nutrition issues and develop nutritional intake estimates for the U.S. population based on the consumption data provided there. How can I do this?
FNDDS is a more appropriate data source for evaluating nutritional intake in the U.S. population and provides comprehensive nutritional information on the foods reported consumed in WWEIA. For further information on FNDDS, please visit: www.ars.usda.gov/northeast-area/beltsville-md/beltsville-human-nutrition-research-center/food-surveys-research-group/docs/fndds/ .
21. The FCID Consumption Calculator only provided fixed percentiles at intervals of 5 percentile points. I'd like to obtain consumption estimates at additional percentiles than those presented in the FCID Consumption Calculator. In addition, I'd like a greater number of decimal points in the answer. How do I do this?
The FCID Consumption Calculator provides standardized statistical output including means, standard error of means, and selected percentile estimates. It also provides estimates using EPA's EFH Default Percentiles. Any additional analysis, such as calculating additional percentiles and standard errors are best performed using dedicated statistical software such as SAS, R, Stata, or another statistical software program that is capable of properly handling complex, multi-stage survey designs. If you wish to conduct any additional analysis using these or similar software, the WWEIA-FCID 2005-10 raw data in .csv format can be downloaded from the JIFSAN website ( fcid.foodrisk.org/dbc/ ).
22. I've been told by my statistician that I need to have (and use) the sampling weights, the PSUs (Primary Sampling Units), and the strata to properly use NHANES/WWEIA survey data. Does the FCID Consumption Calculator use these?
NHANES data are not collected using a simple random sample. Instead, the survey uses a complex, multistage, probability sampling design to select participants. The first step in this process is to select Primary Sampling Units (PSUs) from the survey sampling strata, which is defined by geography and proportions of minority populations. Additional information about survey design are available from www.cdc.gov/nchs/tutorials/dietary/SurveyOrientation/SurveyDesign/Info1.htm The NHANES sampling weights, PSUs, and strata can be important to consider when performing analysis of WWEIA-FCID 2005-10 data. The FCID Consumption Calculator provides estimates of the mean, standard error of mean, and a range of percentiles (up to the maximum reported in the survey). Estimation of mean and percentiles requires appropriate use of the NHANES survey weights in the analysis (which the FCID Consumption Calculator does), but the PSU and strata information is not required. While the PSUs and strata are not needed for the mean and percentiles reported by the FCID Consumption Calculator, they are used - as is appropriate - when calculating standard error of mean (SEM) reported by the FCID Consumption Calculator. Thus, the FCID Consumption Calculator makes use of the necessary survey design parameters for the statistics that it does provide. The “codebook” described in FAQ #26 provides additional information on survey characteristics.
23. What is the difference between "Eaters Only Population" and "Per Capita"?
Eaters only intake rate — The quantity of food consumed per person in a population composed only of individuals who ate the food item of interest during a specified period. Also referred to a “consumers only” in EPA’s Exposure Factors Handbook.
Per capita intake rate — The average quantity of food consumed per person in a population composed of both individuals who ate the food during a specified time period and those that did not.
The 2005-06, ‘07-‘08, and ‘09-‘10 cycles of NHANES-WWEIA include 24,673 individuals who filled out two 24 hour “food diaries”. These respondents provided a total 49,346 food diaries.
The FCID Consumption Calculator can provide food intake statistics for a subset of these food diaries. For example, a user might want to obtain single day estimates of strawberry intake among children 3 to < 6 years old. The 2005-10 WWEIA-FCID survey contains a total of 2,836 diaries for that specific age group, of which, 933, or “35%” eaters who consumed strawberries. The FCID Consumption Calculator can present 2 sets of statistics (N, Mean, SE, Percentiles), based on: (i) the 933 “Eaters Only Population” diaries, and (ii) the 2,836 diaries in the population of children 3 to < 6 years old, consumers and non-consumers of strawberries (per capita). The two sets of statistics are provided on both an absolute grams consumed basis and a gram per kg bodyweight basis.
24. How does the calculator define pregnancy and breast feeding?
The RIDEXPRG variable with (value =1) from the NHANES demographic file was used for determining the pregnancy status and RHQ200 variable with (value =1) from the NHANES reproductive health questionnaire file was used for determining breast feeding status.
For pregnancy this means a “yes” response to either Positive lab pregnancy test or self-reported pregnant at exam.
For breast feeding this means a “yes” response to “Now breastfeeding a child.”
Both variables were included in WWEIA_DEMO_0510 file which is located in the "Database Contents" section of the website ( fcid.foodrisk.org/dbc/ ).
25. What is the best way to interpret results when I search for multiple food commodities combined?
The FCID Consumption Calculator can also provide food intake statistics for a group or set of user-selected commodities when searching by FCID Food Commodity. This “combined” feature is not available when searching by EPA Exposure Factors Handbook Water/Food Groups. Thus, when searching by FCID Food Commodity, the selection of commodities is not limited by the calculator to one at a time.
For example, a user might want to obtain total intake of strawberry in all food forms, including baby food and strawberry juice. Thus, the intake query would reflect “strawberry” OR “strawberry-baby food” OR “strawberry, juice” OR “strawberry, juice-babyfood”. If an individual consumes all of those commodities on a given day, the commodities would be summed together for that individual and the total consumption for that individual on that day would be the relevant consumption. For example, for children 3 to < 6 years old, there are 1,624 consumption diaries that report eating at least one of those “strawberry” commodities, with a mean consumption of 14.62 grams. Again, when querying multiple commodities simultaneously, a consumption diary would be incorporated into the final estimates whether it was consumption of just one of the multiple commodities or consumption of all of the queried commodities in a day, or some combination in between. This can be useful when looking for consumption of food categories that are broader than a single commodity; for example, the more inclusive “pome fruits” instead of apples, or “poultry” instead of chicken.
26. I looked at the WWEIA-FCID 2005-2010 files and do not know what the field names and codes in the files represent. Where can I get additional information on the list of variables and data fields available in WWEIA-FCID 2005-2010?
Data users who are interested in additional information on the content of WWEIA-FCID 2005-2010 are
encouraged to consult the
WWEIA-FCID 2005-2010 Background Codebook here. The codebook provides an introduction to and listing of the
variables and fields available in
WWEIA-FCID 2005-2010 and is intended to assist the new data user in understanding the structure and
function of the available files. Much of the information in the Background Codebook is derived or
originated from the NHANES/WWEIA survey. As such, data users are encouraged to read and be familiar
with the background, statistical, and survey information provided by both NCHS (including their
website tutorials) and the USDA with respect to this data.
27. What Criteria does the FCID calculator use to determine reliability of percentiles?
FCID calculator uses the recommendation from Joint Policy on Variance Estimation and Statistical Reporting Standards on NHANES III and CSFII - min(np , n(1-p)) < 8* Design effect (DE) – to determine reliability for uncommon or very common extreme percentiles ( P ≤ 0.25 or P ≥ 0.75) . Here, n is the sample size of the selected sub-population and p indicates proportion corresponding to the percentile. Note that 8 * DE rule is not recommended for midrange percentiles ( > 0.25 or < 0.75). There is a different “rule of thumb” for those percentiles – it will be unreliable if sample size < 30*DE. But using that criteria requires assumption of normality of estimates or symmetric population. These conditions are difficult to satisfy for consumption data which are typically skewed and asymmetric. Therefore, the FCID calculator currently does not use that criteria for midrange percentiles.
The recommendation from Joint Policy on Variance Estimation and Statistical Reporting Standards on NHANES III and CSFII Reports: HNIS/NCHS Analytic Working Group Recommendations can be found in Appendix B in the following link: www.cdc.gov/nchs/data/nhanes/nhanes3/nh3gui.pdf
See also p.2-3 of “Healthy people 2010 Criteria for Data Suppression (2002) at www.cdc.gov/nchs/data/statnt/statnt24.pdf
Additional Information
-
EPA/OPP Assessing Health Risks from Pesticides:
www.epa.gov/pesticide-science-and-assessing-pesticide-risks/assessing-human-health-risk-pesticides . -
EPA/OPP's Dietary Exposure Evaluation Model (DEEM):
www.epa.gov/pesticide-science-and-assessing-pesticide-risks/deem-fcidcalendex-software-installer . -
EPA/Office of Research and Development's Stochastic Human Exposure and Dose Model for Multimedia,
Multipathway Chemicals (SHEDS):
www.epa.gov/heasd/products/sheds_multimedia/sheds_mm.html . -
EPA's Exposure Factors Handbook:
cfpub.epa.gov/ncea/cfm/recordisplay.cfm?deid=20563 . -
EPA Pesticide Residue Chemistry Test Guidelines (OPPTS 860.1000 Background): Table 1. Raw Agricultural
and Processed Commodities and Feedstuffs Derived from Crops.
www.regulations.gov/#!documentDetail;D=EPA-HQ-OPPT-2009-0155-0002 . -
EPA Crop Grouping Tables 40CFR 180.41:
www.ecfr.gov/cgi-bin/text-idx?SID=4983f0c35c9b51905a72605bdd07ff72&mc=true&node=se40.26.180_141&rgn=div8 . -
EPA's ExpoBox:
www.epa.gov/expobox .
What's New in FCID 2005-2010
The FCID Consumption Calculator was originally developed using the data from NHANES 2003-2008. The tool and FCID have been updated to include the data from NHANES 2005-2010. These updates include the following capabilities and features:
- A point-and-click user interface that makes the underlying WWEIA data more accessible, as well as raw data files in .csv format which can be imported into a variety of database and statistical software programs for further analysis and more detailed reporting.
- The ability to determine which food commodities (ingredients) are present in a given food or, the reverse, which foods contain a given food commodity, and their respective amounts or proportions. In addition, the cooked status (yes/no), cooking method (baked, boiled, fried, etc.) and food form (fresh, frozen, dried, canned, etc.) are also provided.
- The ability to "match" U.S. EPA FCID (crop group) codes for agricultural commodities and their crop group codes to corresponding codes and descriptions from the Codex Alimentarius Commission, an international organization established to protect consumer health and promote fair practices in food trade.
- The ability to generate estimates of mean and various percentile consumption values of a given food commodity for the total population and various user-defined age and racial/ethnic subgroups. This can be done on both a per capita and "eaters only" basis and can be output in both an absolute gram consumption and gram consumption/kg body mass basis.
- The commodity selections in recipes and percentile calculator have been updated to allow input from touch screen devices.
- The convention “<0.5”, “<0.05” or “<0.005” have been programmed into the Commodity Consumption Calculator to indicate that a value is strictly less than the small value indicated and "0" indicates a true zero. In the earlier version of the site, a 0 was used to both reflect true zeroes (e.g., user-only consumption at the 50th percentile when only 30% of the population consumed the commodity of interest) and actual consumption values when the consumption was less than ~ 0.1 grams (or 0.1 g/kg body mass).
- The number of decimal places have been increased from one decimal place to two decimal places for the mean and standard error of the mean in response to user feedback on the Commodity Consumption Calculator led to increasing the number of decimal points in the output. In addition, to accommodate this increase, the webpage display has been widened.
- The addition of a time-stamp on the Excel (csv) and Word export function so users can track when they performed a query and what version/data-years were used.
- The addition of capabilities to export results in both Excel (csv) and Word format to provide greater flexibility to users.
- The addition of direct water consumption (tap and bottled water) to the menu. Direct water consumption, defined as consumption of tap or bottled, is now included in the Commodity Consumption Calculator (search for “water, direct, tap” or “water, direct, bottled”). The previous calculator only included “indirect” water consumption (defined as consumption of water as a result of adding it to soups, juice concentrates, etc.). To obtain consumption of direct water the user was required to go to a separate (Excel-compatible) .csv file available on the website in the “Database Contents” section. In addition, community water, bottled water, and all sources of water intake have been included when searching by EPA Exposure Factors Handbook Food/Water (see FAQ#14).
- Beginning in 2005-2006, information on all water consumption was collected during the 24-hour recall and reported in the NHANES/WWEIA “Individual Foods” file, including tap water and bottled water. Therefore, direct drinking water records are now included by NHANES/WWEIA in the “Individual Foods” file for participants who consumed water, and water consumption is captured in the new 2005-2010 FCID release in a manner similar to food commodity consumption with specific meal designations (e.g., “snack”, “breakfast”, etc.) and times associated with these events. This contrasts with the 2003-2008 FCID release which included daily direct water consumption by individuals in separate file that was distinct from the files which contained food commodity consumption.
- Recipe fixes have been performed in updating the WWEIA-FCID to the 2005-2010 survey cycles; some existing recipes were found to have some anomalous results. These included infant formula (8 recipes “prepared from powder”) that did not include indirect water as well as those that did include indirect water but shouldn’t have (e.g., “Red Bull” and “Energy Drink” recipes), and a number of recipes with ingredient contributions equal to zero. In this new version, these issues have been fixed. However, despite these fixes and as described in FAQ #13, it remains the case that “old” recipes, as a matter of practice, are generally not updated.
Changes and corrections to FCID commodity codes have been performed. Ancillary information such as “FCID_Code” or “Cooked_Status” for non-FCID commodities are now blank/missing values.
The WWEIA-FCID contains recipes for all foods (e.g., lasagna) that were reported consumed in several national food consumption surveys, including CSFII 1994-1996, 1998, WWEIA 1999-2010. However, there are 40 food items (e.g., “ginger ale, sugar-free”, “gin”) that do not include any FCID-relevant commodities. For these food items, the FCID Recipe database contains a record, but the values for FCID_Code, Cooked_Status, Food_Form and Cooking_Method are set to missing (i.e., they are left blank).
- - Recoded some commodities to reflect new crop groups (e.g., Tropical Fruits with edible peel, and Tropical Fruits without edible peel)
- - Modified codes to reflect change in crop group for specific commodities (e.g., Kale, Collards)
- - Corrected miscode for some food items (e.g., coconut oil babyfood)
- - Corrected miscode for several Food items: Cooked_Status (CS=0), Food_Form (FF=9)
- - Recoded all indirect water as “water, indirect, all sources”
- The addition of Exposure Factors Handbook Food groups and water. Users can estimate intake rates for the groups of foods and water as presented in EPA’s Exposure Factors Handbook for various standard or user defined age groups and population groups. This feature makes it easier for developers and users of the EFH to update food consumption tables.
- The addition of capabilities to estimate consumption for various age groups and population groups at a time. Previous versions of the FCID calculator only allow for the estimates of intake rates for one age group at a time.
- The addition of a progress line to allow the user to go back to the previous screen. The progress line also shows the user where they are in the process.
- The addition of EPA’s Exposure Factors Handbook and EPA’s Pesticides default age groups and population groups. This version of the FCID consumption calculator allows the user to select either the “EPA EFH default” or “EPA Pesticide default” age groups or population groups. EFH default are more general and used in different program offices within EPA. EPA “Pesticide default” population group is more specific and used within OPP for pesticide regulation purpose. It can be observed that “EFH default” are more finely defined and may have smaller sample size than the “Pesticide default” age groups in general. It should be noted that small sample size impacts the reliability and precision of the estimates for the population of interest.
Glossary of Terms
- Agricultural commodity — Used by U.S. EPA to mean plant (or animal) parts consumed by humans as food. When such items are raw or unprocessed, they are referred to as "raw agricultural commodities." Raw agricultural commodities include, among other things, fresh fruits, whether or not they have been washed and colored or otherwise treated in their unpeeled natural form; vegetables in their raw or natural state, whether or not they have been stripped of their outer leaves, waxed, prepared into fresh green salads, etc.; grains, nuts, eggs, raw milk, meats, and similar agricultural produce. It does not include foods that have been processed, fabricated, or manufactured by cooking, freezing, dehydrating, or milling.
- As-eaten intake — Intake rate based on the weight of the food in the form that it is consumed (e.g., cooked or prepared).
- Community water — Includes tap water ingested from community or municipal water supply.
- Consumption Diary — Survey in which individuals are asked to record food intake in a diary which is later used to evaluate exposure factors associated with specific populations.
- Consumer Only intake rate — See eaters only.
- Dietary recall — A method for collecting dietary information from respondents. NHANES uses a standard set of measuring guides to help the respondent report the volume and dimensions of the food items consumed.
- Direct water ingestion — Consumption of plain water as a beverage. It does not include water used for preparing beverages such as coffee or tea.
- Dose — The amount of an agent that enters a target after crossing an exposure surface. If the exposure surface is an absorption barrier, the dose is an absorbed dose. If the exposure surface is not an absorption barrier, the dose is an intake dose.
- Drinking water — All fluids consumed by individuals to satisfy body needs for internal water.
- Eaters only intake rate — The quantity of food consumed per person in a population composed only of individuals who ate the food item of interest during a specified period. Also referred to as consumers-only.
- Exposed foods — Foods grown above ground.
- Exposure — Contact between an agent and a target.
- Exposure assessment — The process of estimating or measuring the magnitude, frequency, and duration of exposure to an agent, along with the number and characteristics of the population exposed.
- Exposure factor — Factors related to human behavior and characteristics that help determine an individual's exposure to an agent.
- Food and Feed Commodity Vocabulary — An on-line tool developed to consolidate all the major EPA pesticide program commodity vocabularies into one standardized vocabulary. The vocabulary contains only human consumable commodities and livestock feeds.
- Intake — The process by which a substance crosses the outer boundary of an organism without passing an absorption barrier (e.g., through ingestion or inhalation).
- Intake rate — Rate of inhalation, ingestion, and dermal contact depending on the route of exposure. For ingestion, the intake rate is simply the amount of food containing the contaminant of interest that an individual ingests during some specific time period (units of mass/time). For inhalation, the intake rate is the rate at which contaminated air is inhaled. Factors that affect dermal exposure are the amount of material that comes into contact with the skin, and the rate at which the contaminant is absorbed.
- Per capita intake rate — The average quantity of food consumed per person in a population composed of both individuals who ate the food during a specified time period and those that did not.
- Plain tap water — Excludes tap water consumed in the form of juices and other beverages containing tap water.
- Protected foods — Foods that have an outer protective coating that is typically removed before consumption.
- Ready-to-feed — Infant and baby products (formula, juices, beverages, baby food), and table foods that do not need to have water added to them prior to feeding.
- Risk — The probability of an adverse effect in an organism, system, or population caused under specified circumstances by exposure to an agent.
- Risk assessment — A process intended to calculate or estimate the risk to a given target organism, system, or population, including the identification of attendant uncertainties, following exposure to a particular agent, taking into account the inherent characteristics of the agent of concern as well as the characteristics of the specific target system. The risk assessment process includes four steps: hazard identification, hazard characterization (related term: Dose response assessment), exposure assessment, and risk characterization. It is the first component in a risk analysis process.
- Tap water from food manufacturing — Water used in industrial production of foods.
- Total tap water — Water consumed directly from the tap as a beverage or used in the preparation of foods and beverages (i.e., coffee, tea, frozen juices, soups, etc.).